
Data from BESS installations
In our previous articles -one outlining how BESS installations work and the markets they operate in, and another covering grid services and energy trading – we explored the design of battery energy storage systems, their markets, and the platforms needed to manage these installations. This time, let’s look at a less visible part of the picture: data. At first glance, it seems straightforward. If a BESS has a specified power rating and energy capacity, and its control system displays the battery’s state of charge, we should know how much energy is still available. Well, not necessarily.
From the storage owner’s perspective, what matters most is not the energy capacity on the nameplate, but how much energy can actually be delivered to the grid over a given period, at what power level, and within warranty conditions. For the system operator, the question is whether that energy will be available exactly when needed. These two perspectives meet in the analysis of measurement, operational, historical, and market data. The quality of that data determines whether we use the BESS’s actual capabilities or merely manage a more or less accurate approximation of them.
Battery state of charge: A seemingly simple indicator
Let’s start with the best-known parameter: SoC (State of Charge). In simple terms, it expresses the battery’s charge level as a percentage of an assumed reference capacity. When the operator’s dashboard shows 60%, we intuitively read it like a car’s fuel gauge or a phone’s battery indicator: we still have 60% left. But the meaning is not quite as clear-cut. You cannot simply insert a probe into a battery and measure its remaining energy the way you measure the liquid level in a tank. In addition, for applications such as grid services, the actual amount of energy the system can absorb or deliver is much more useful (in MWh rather than as a percentage).
A typical BMS (Battery Management System) estimates SoC using voltage, current, and temperature measurements together with appropriate models. One method is coulomb counting, which integrates the current flowing into and out of the battery. It works reasonably well, but measurements have errors, and those errors can accumulate. Voltage-based correction also has limitations, particularly with today’s widely used lithium iron phosphate (LFP) cells. Their voltage curve is relatively flat across a broad charge range, making errors easy to introduce. A small voltage difference therefore does not always provide a clear answer about how much energy remains in a cell.
ACCURE, an independent battery analytics company, reports that its collected data shows state-of-charge estimation errors in LFP installations can reach approximately ±15%, and can be even greater in some cases. Physics-based models and advanced data analytics can reduce this error to below ±2%. However, this often involves a “BMS reset” procedure requiring a complete battery discharge and recharge cycle, which may not be feasible within the battery’s operating schedule.
SoC, SoH, and the energy actually available
Now for the next piece of the puzzle. The battery’s state of charge (SoC) does not tell us its available capacity. Cells age over time, and their ability to store energy changes. One indicator used to describe this is SoH (State of Health), which reflects the battery’s condition. The extent of this degradation is often addressed in the agreement with the supplier. Even if two modules display the same 60% SoC, they may not contain the same amount of energy. One may have a lower actual capacity, while another may be operating at an unfavorable temperature or have a power limit imposed by protective functions or an upcoming balancing cycle.
There are also system-wide constraints: the permitted SoC operating window, PCS conversion efficiency, auxiliary power for cooling and heating, transformer limits, and the availability of individual containers and modules. As a result, SoE (State of Energy), an estimate of the energy that can actually be delivered, increasingly appears alongside SoC. For energy trading, the key question is how many MWh the system can deliver to the point of interconnection, over what period, and at what power level – in other words, how much a trader can commit to the energy or balancing services market.
Of course, SoE is not a single, universal device reading. It must be calculated using the battery’s condition, efficiency, technical constraints, and current BESS operating schedule. The availability of a system prepared for a one-hour discharge will differ from that of an asset that must also maintain a reserve for balancing services, while staying within warranty limits on cycle counts and temperatures. That is why data on energy, power, and constraints should form a single, consistent asset model rather than reside in separate applications and spreadsheets. This availability is often defined in the warranty agreement using a formula such as:

Lost hours: (unplanned downtime + planned downtime + maintenance downtime + hours with external constraints)
A BESS management platform should monitor this value according to its contractual definition and provide reporting to support discussions with the supplier if availability measured using the formula differs substantially from the stated figure. These stated figures for actual availability – that is, annual operating time without technical constraints – often exceed 99%.
What are five percentage points worth in a BESS?
Suppose we have a BESS facility with a power rating of 100 MW and a reference energy capacity of 200 MWh. Assume the system displays 50% SoC, but an estimation error means the actual state of charge is five percentage points higher. For this example, we simplify the relationship between SoC and energy to a linear one, disregarding capacity variation and minimum SoC limits. The difference is then 200 MWh × 5% = 10 MWh of energy stored in the batteries.
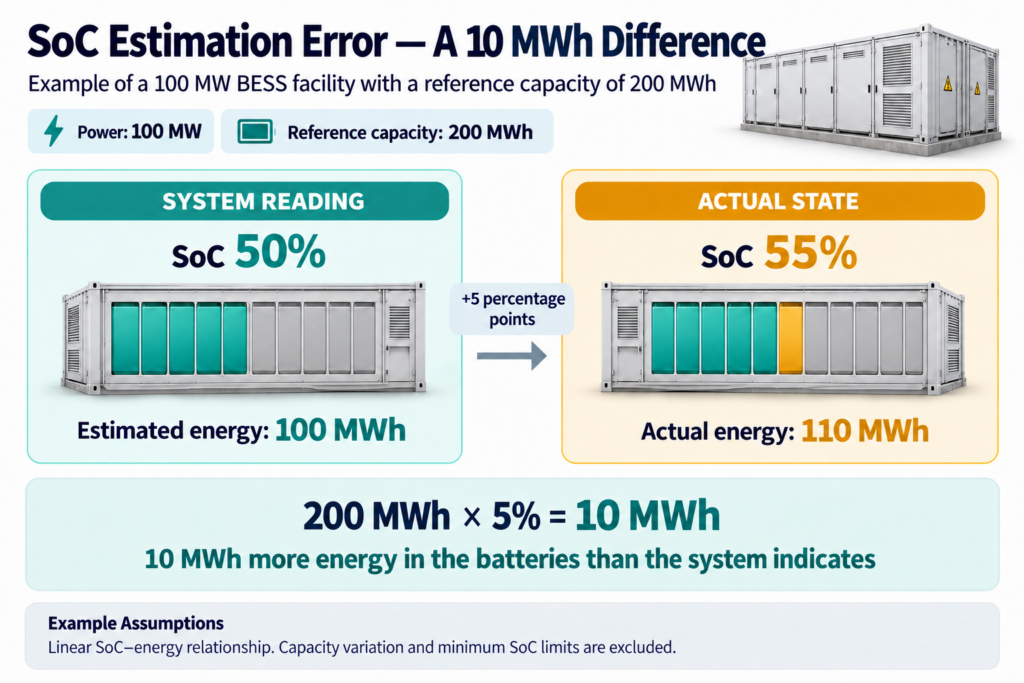
That is not yet 10 MWh we can sell. If we assume 85% efficiency in transferring this additional energy from the batteries to the settlement metering point, about 8.5 MWh remains. At a hypothetical price of PLN 400/MWh, this represents gross sales of approximately PLN 3,400 in a single event. This is not profit, of course, but rather a missed opportunity: we have not included the cost of earlier charging, degradation costs, fees, market constraints, or whether an opportunity to sell at that price will arise at all. Still, it illustrates why reliable estimates of the asset’s capabilities are worth pursuing.
The situation also works in reverse. If the BMS overestimates SoC and we submit a market offer exceeding the system’s actual energy delivery capability, we risk missing the operating schedule, having to cover energy shortfalls, or incurring contractual penalties. A prudent operator will then build in a larger safety margin using another unit. The problem is that a wide margin protects against errors but may also leave part of a fully functional asset unused. Better data does not eliminate the battery’s physical constraints – it allows us to identify more precisely where those constraints actually lie.
Availability: is the BESS ready, or does it just report that it is?
SoC accuracy is one issue; the technical availability of the entire BESS facility is another. In an ACCURE study published in September 2026 covering more than 50 operating projects, the median availability reported by the installations – the middle value among all measured values – was 96.7%, while median availability measured by the components’ actual response to commands was 94.1%. The difference is 2.6 percentage points. These are results for the study sample and the methodology used, rather than a figure that can be assigned to any storage installation.
Why the discrepancy? A device may be visible on the communications network and have no active critical alarm, yet still fail to reach the requested power level or execute a command within the required time. We therefore need to distinguish “online” status from the ability to perform a specific task. Another question is whether an entire BESS facility is available when one container is offline but the others can still provide some services. There is no simple answer: we need to know how much power and energy are available, for how long, and under what conditions. In our GridConnect platform, we call this dispatch availability planning.
Likewise, at the operational level, collecting alarms and displaying them on a screen is not enough. We need to record command histories, equipment responses, deviations from schedules, power limits, downtime, and maintenance events. It helps if alarm management can be linked to an external service ticketing system. Better still, technicians should receive guidance on what to do based on previous faults of a similar type. Only this combined view allows us to determine whether lost availability stems from an equipment failure, a BMS protective function, a communications problem, or an inaccurate estimate of the installation’s capabilities.
From thousands of signals to one operator decision
As you can imagine, a large BESS facility has an enormous number of variables: cell temperatures and voltages, current measurements, module and container states, PCS parameters, energy meters, protection devices, HVAC systems, medium- and high-voltage equipment, and signals from the local SCADA system. Simply gathering this data in one place does not mean it can support better decisions. An architecture is needed to ensure appropriate data quality, timestamps, and links to specific devices.
The architecture of GridConnect, our modern BESS management platform, has three main areas. The first is the local layer – BMS, PCS, automation, SCADA, and an edge device – where measurements are acquired and critical control tasks are performed. The second is the operational EMS layer, which gives the operator a consistent view of one or more installations, event and availability records, and operating schedules. The third covers analytics and historical data, supporting estimates of capacity, efficiency, and technical condition, availability forecasts, and the delivery of reliable information to trading systems.
| Area | What data and tasks? | What does the user get? |
| Local / edge | BMS, PCS, SCADA, protection devices; industrial communications; local control and buffering | Reliable signals and safe command execution |
| Operational / EMS | Equipment model, statuses, alarms, constraints, operating schedules, and deviations | Current operating capability of the installation and operator support |
| Analytics / historical / business | SoC/SoE/SoH, efficiency, degradation, cycles, data quality, forecasts | Estimates of capabilities and risks in future periods |
| Market / optimization | Price data, schedules, availability declarations, settlements | An offer and schedule aligned with the asset’s actual capabilities |
Table 1. From technical data to business decisions: An example allocation of BESS platform responsibilities.
Our GridConnect concept, explored at ConnectPoint during work on platforms for large storage installations, calls for precisely this separation of responsibilities. The equipment and integration layer includes local SCADA systems, edge devices, and protocols such as IEC 60870-5-104, MQTT, and OPC UA. At the center are the asset model, operational platform, and data exchange infrastructure. Above them sit a data lakehouse for historical records and integration with applications responsible for trading and optimization. This describes an architectural direction and use cases; it does not claim that every listed function has already been implemented in every such system.
In this architecture, we should not move safety functions or fast control from local controllers to database analytics simply because the database offers a more convenient computing environment. The supervisory platform can provide estimates and schedules, but local protection systems must retain their autonomy. Communications quality is just as important: missing signals, ambiguous timestamps, or a communications outage affecting one asset can quickly turn a good analytical model into one operating on an outdated view of the situation. These scenarios also require a plan.
Forecasting capabilities, not just recording events
It is time to move from current monitoring to the future. When providing services in the energy and balancing markets, knowing how much power a storage system has available at a given second is not enough. We also need to estimate how much will be available in an hour, tomorrow, and over the coming days, accounting for current SoC, planned cycles, temperatures, maintenance outages, and existing commitments. One use case considered in the GridConnect architecture materials is estimating dispatch availability over a longer horizon – a good example of how far today’s requirements extend beyond a simple screen of battery parameters. Given the structure of energy and balancing services markets, reliable estimates covering at least two days are essential.
This analysis involves at least two types of data. The first comes from the storage system itself and describes its technical constraints. The second comes from external sources: operator instructions, forecasts of operating conditions, and required reserves. Only by combining the two can we answer a practical question: can I offer 80 MW and 100 MWh for a specified period without conflicting with another commitment or a battery operating limit?
Comparing the schedule with actual performance is also important. If a trader planned a specific discharge profile but the facility delivered less energy, the difference alone explains little. We need a history of setpoints and actual values, the state of the assets at the time of the event, and the cause of the constraint. This information supports not only settlement of the storage system’s operation, but also improvements to subsequent estimates and verification of the parameters declared by equipment suppliers.
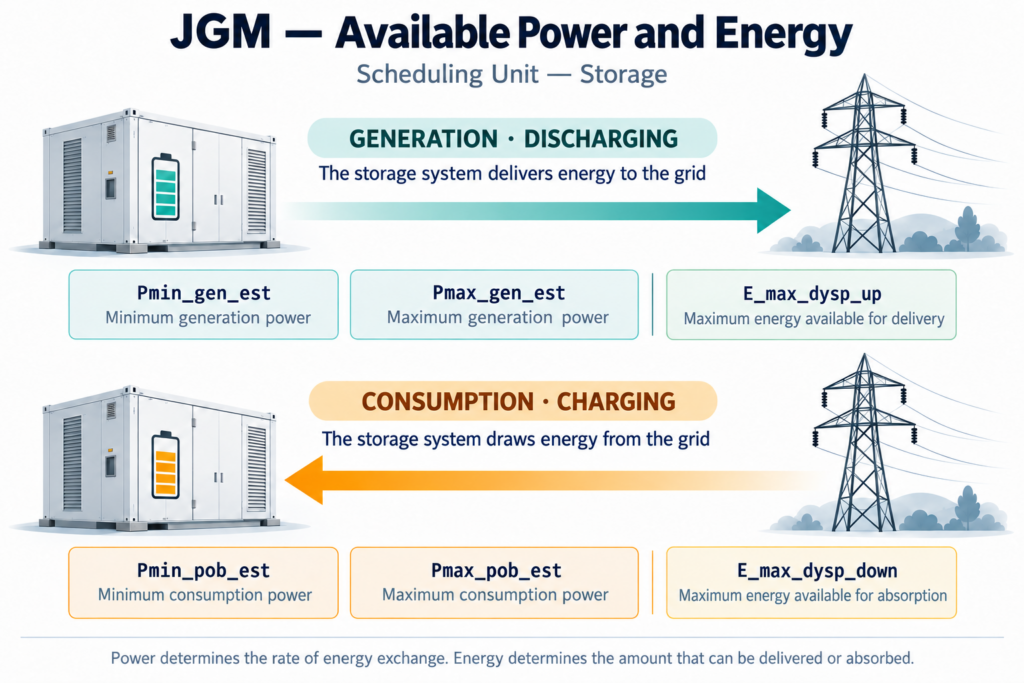
Interestingly, forecasting storage availability is more than an owner’s idea for more effective energy trading. In Poland, PSE also requires relevant data. For JGM scheduling units (storage scheduling units), the operator expects estimates of minimum and maximum power in both the generation and consumption directions (Pmax_gen_est, Pmin_gen_est, Pmax_pob_est, Pmin_pob_est), as well as the maximum energy the storage system can deliver to or draw from the grid (E_max_dysp_up and E_max_dysp_down). This distinction matters because a system may have sufficient power available at a given moment but be unable to sustain it for the entire scheduled period because of its current SoC, temperature, or technical constraints. BPKD-DB (Intraday) schedules have a 15-minute resolution, while BPKD-CR (Real-Time) schedules have a 5-minute resolution, so the forecast must refer to specific points in time rather than just the facility’s overall availability. In addition, key measurements and signals describing current JGM operation are transmitted to the LFC system every 1–2 seconds, allowing us to continuously verify estimates, detect deviations, and adjust subsequent forecasts.
Historical data, degradation, and operating costs
One more issue remains – an important one, although its consequences usually become visible only over time. Battery energy storage systems are assets that wear out with use. Every charge and discharge cycle has consequences that depend on factors such as depth of discharge, temperature, operating power, and cell chemistry. To assess the profitability of future transactions reliably, we cannot consider only the purchase and sale prices of energy. Under the warranty, the supplier specifies how much battery capacity may decline in subsequent years, assuming proper operation by the user.
Historical data lets us track capacity loss, differences between modules, actual round-trip efficiency, the number and characteristics of cycles, and operating time under specific conditions. We can then attempt to estimate the asset wear cost associated with a particular operating strategy and compare it with additional revenue. We must, of course, avoid presenting such an estimate as a falsely precise figure: degradation depends on many factors, and models require periodic calibration and validation against measured data.
For example, two trading strategies may generate similar gross revenue, while one requires more frequent and deeper battery cycles. If our economic model includes only energy settlements, we will treat them as equivalent. Once we add efficiency, warranty conditions, and estimated wear costs, the result may look different. This is precisely where historical analytics, the service system, and operational planning should draw on the same reliable information base. We can determine the “actual cost per cycle.”
How can we make the most of every percent of BESS battery capacity? First, we need to measure it reliably
There is no single method that guarantees maximum utilization of every BESS. A battery storage system used for price arbitrage and balancing market services will operate differently from an installation maintaining reserves for the operator, or from a BESS behind the meter at a large industrial plant. In every case, however, the starting principle should be the same: move from data collected at the installation to a model of its actual capabilities, and only then to operational and business decisions.
If we do not know where our storage system’s technical capabilities end, we will either take excessive risks or continually maintain an expensive safety margin. This is perhaps the strongest argument for investing in a robust BESS data platform and analytics: it will not replace the cells, converters, or operator, but it will help us make much better use of what the investor has already paid for.